Custom Products for the Digital (data) Enthusiast
Notes on the Kenwood TM-V71A
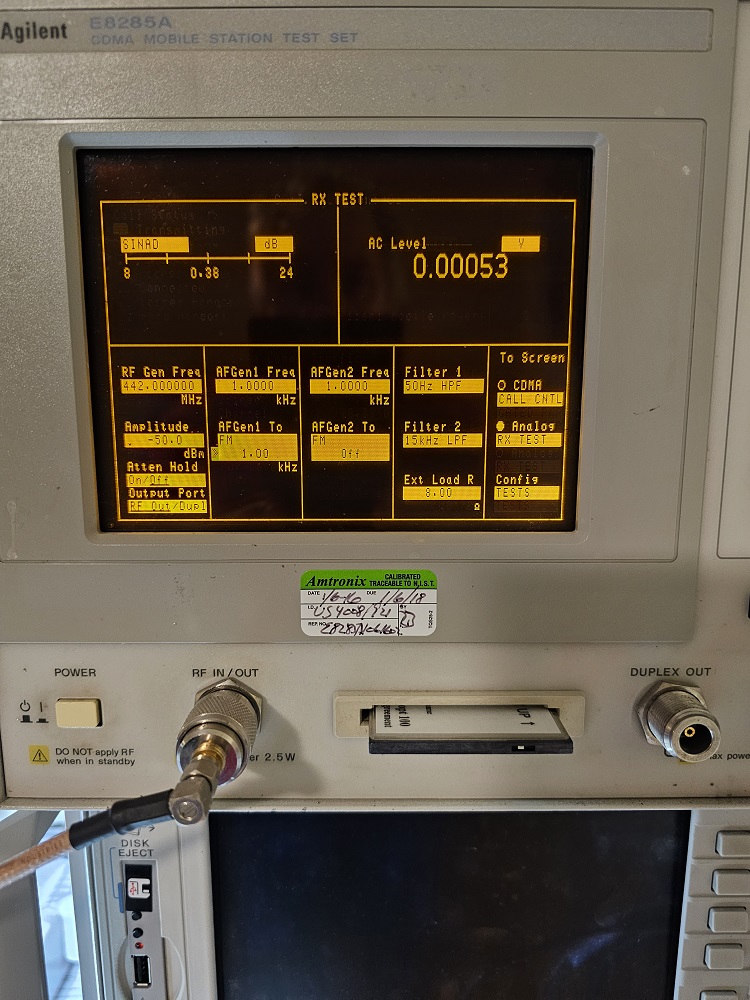
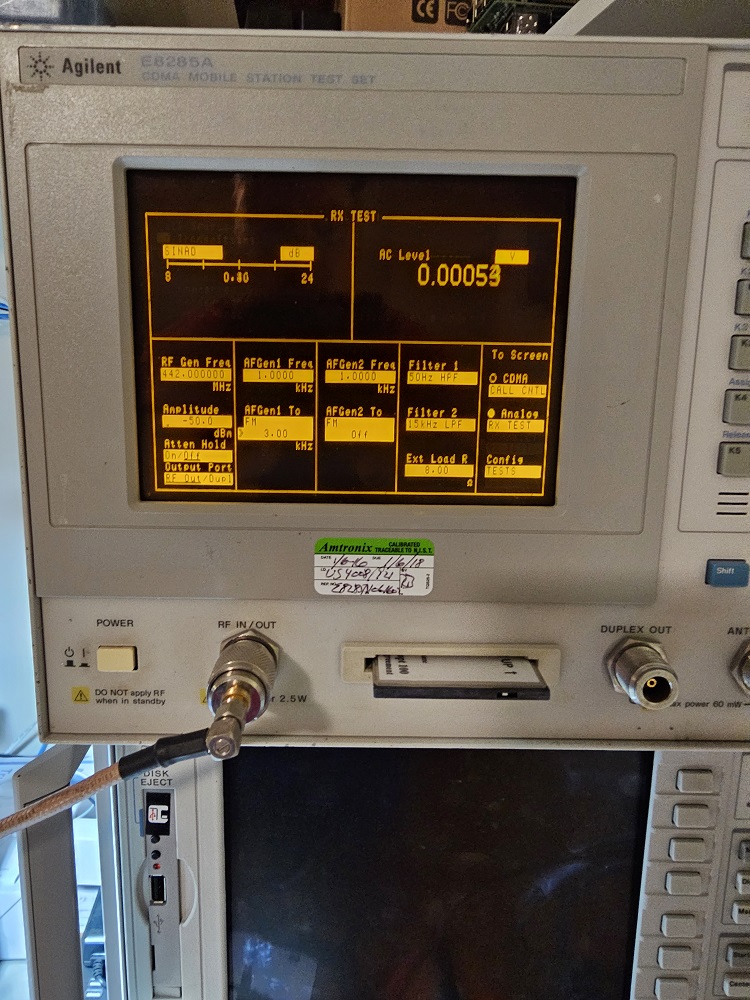
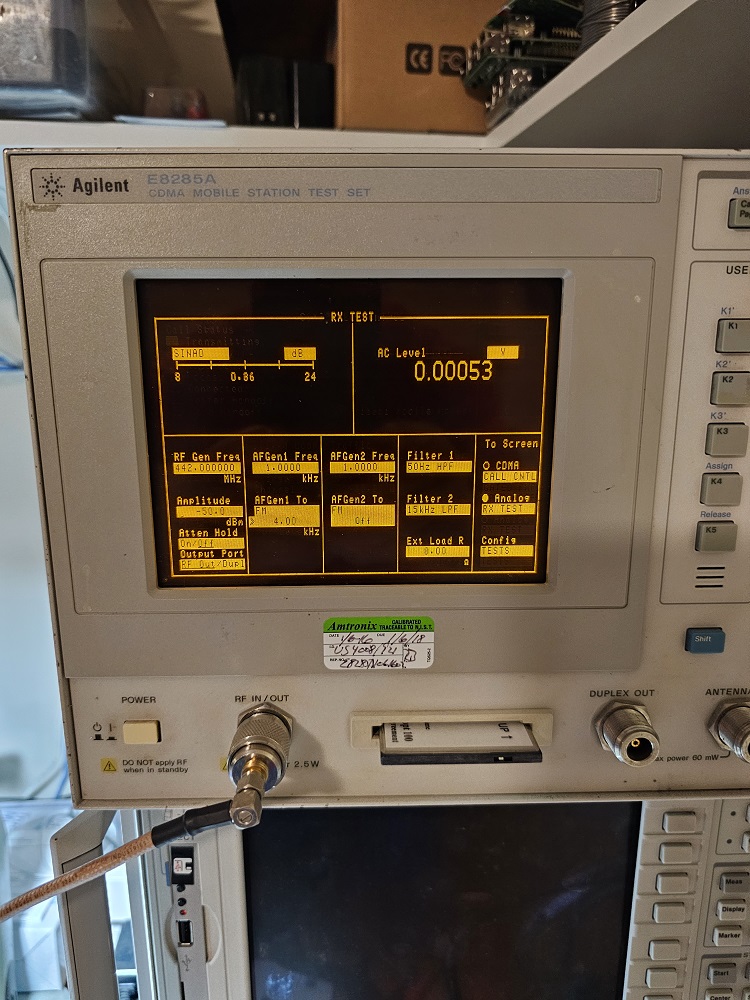
The following are images of the amplitude response of pin 4 of the data port
with a 1kHz tone at several deviations 1, 2, 3, 3.5, 4, 4.5, and 5 kHz.
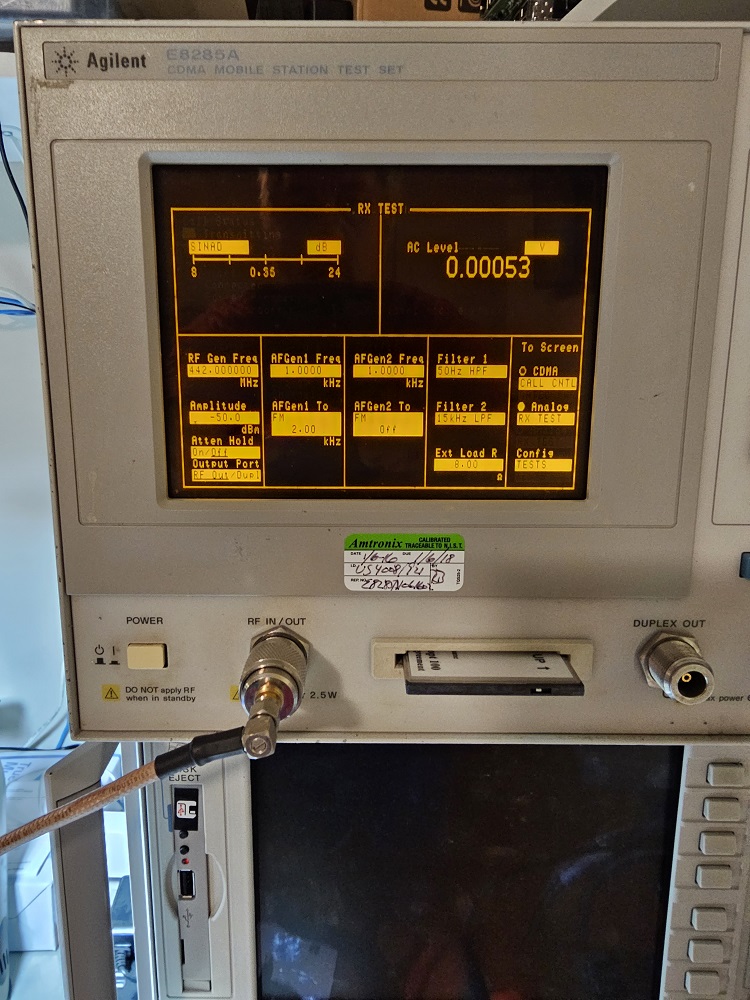
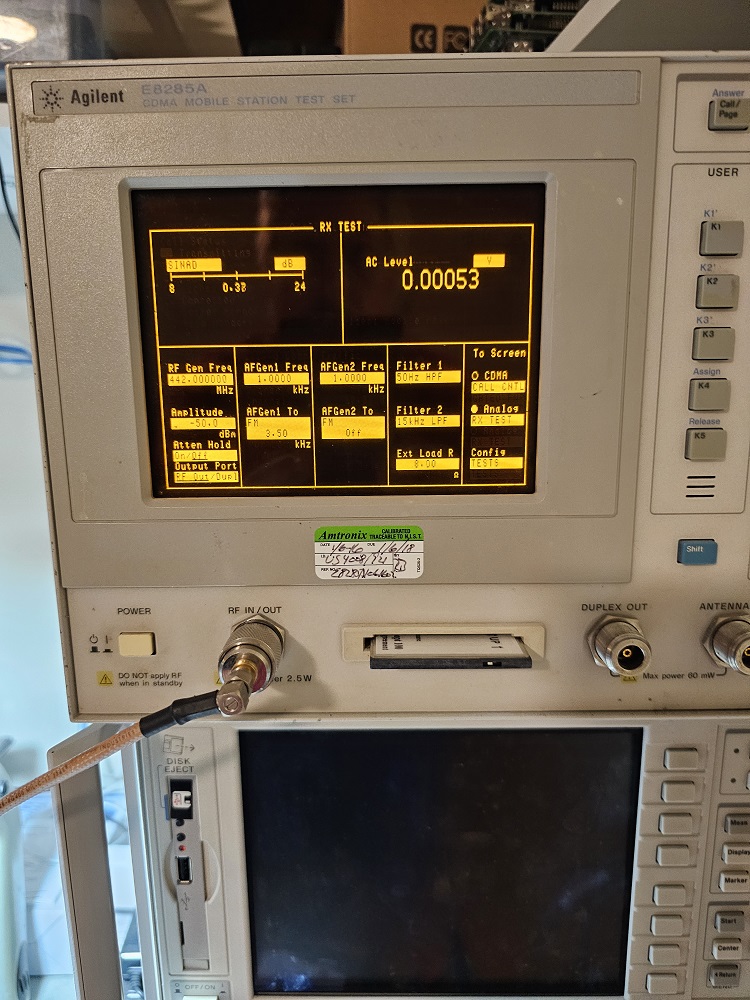
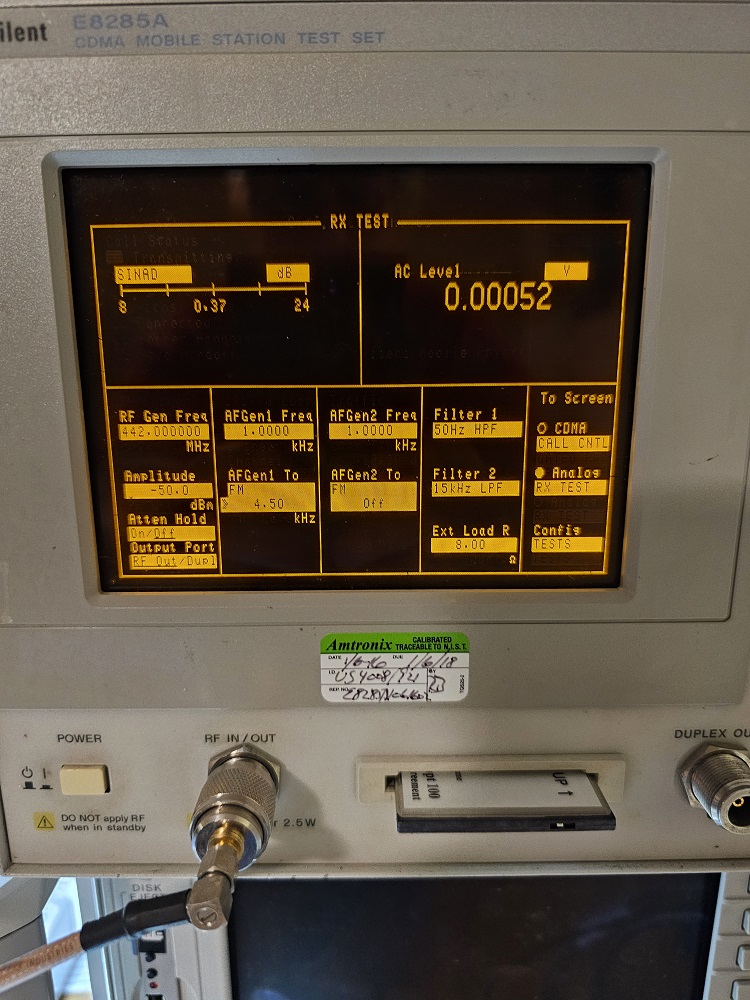
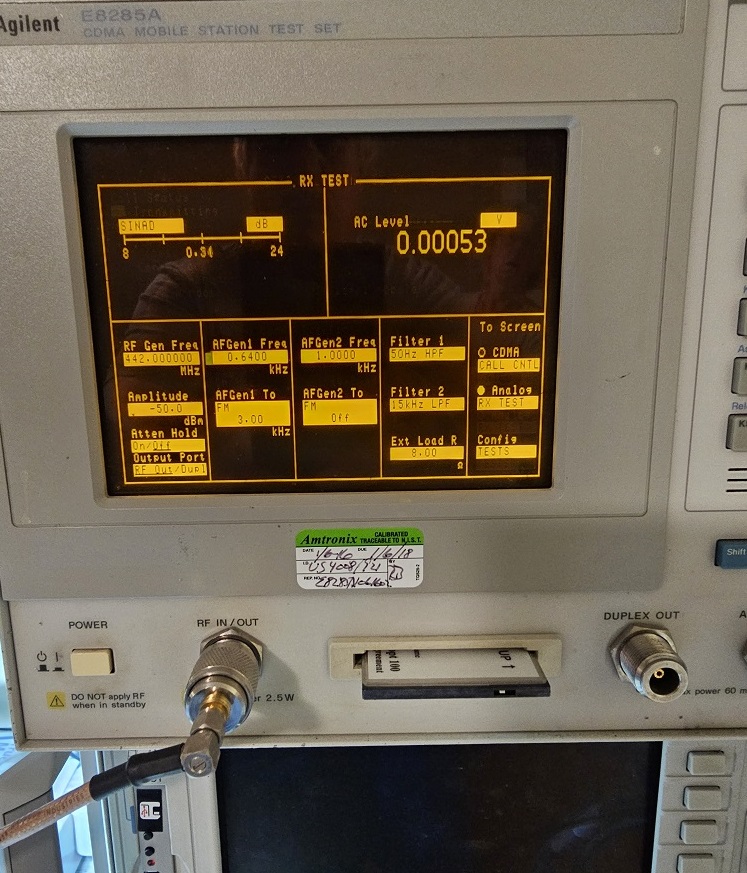
The left photo is the display of the service monitor. The "AF1GEN" field shows
it goes to the FM modulator and references the deviation in kHz.
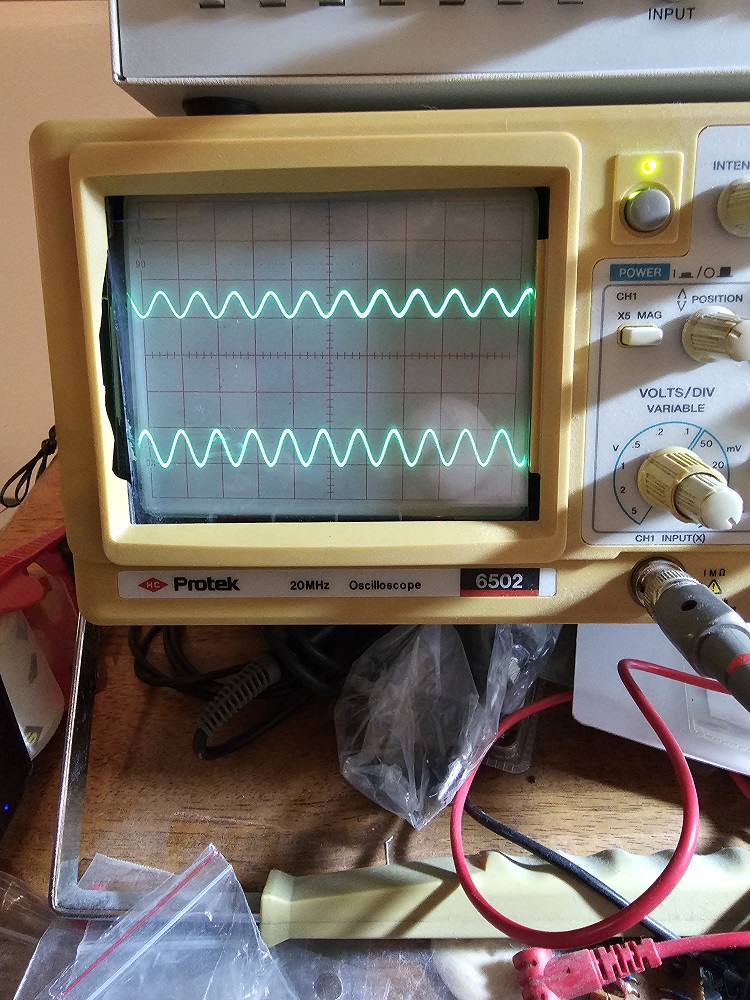
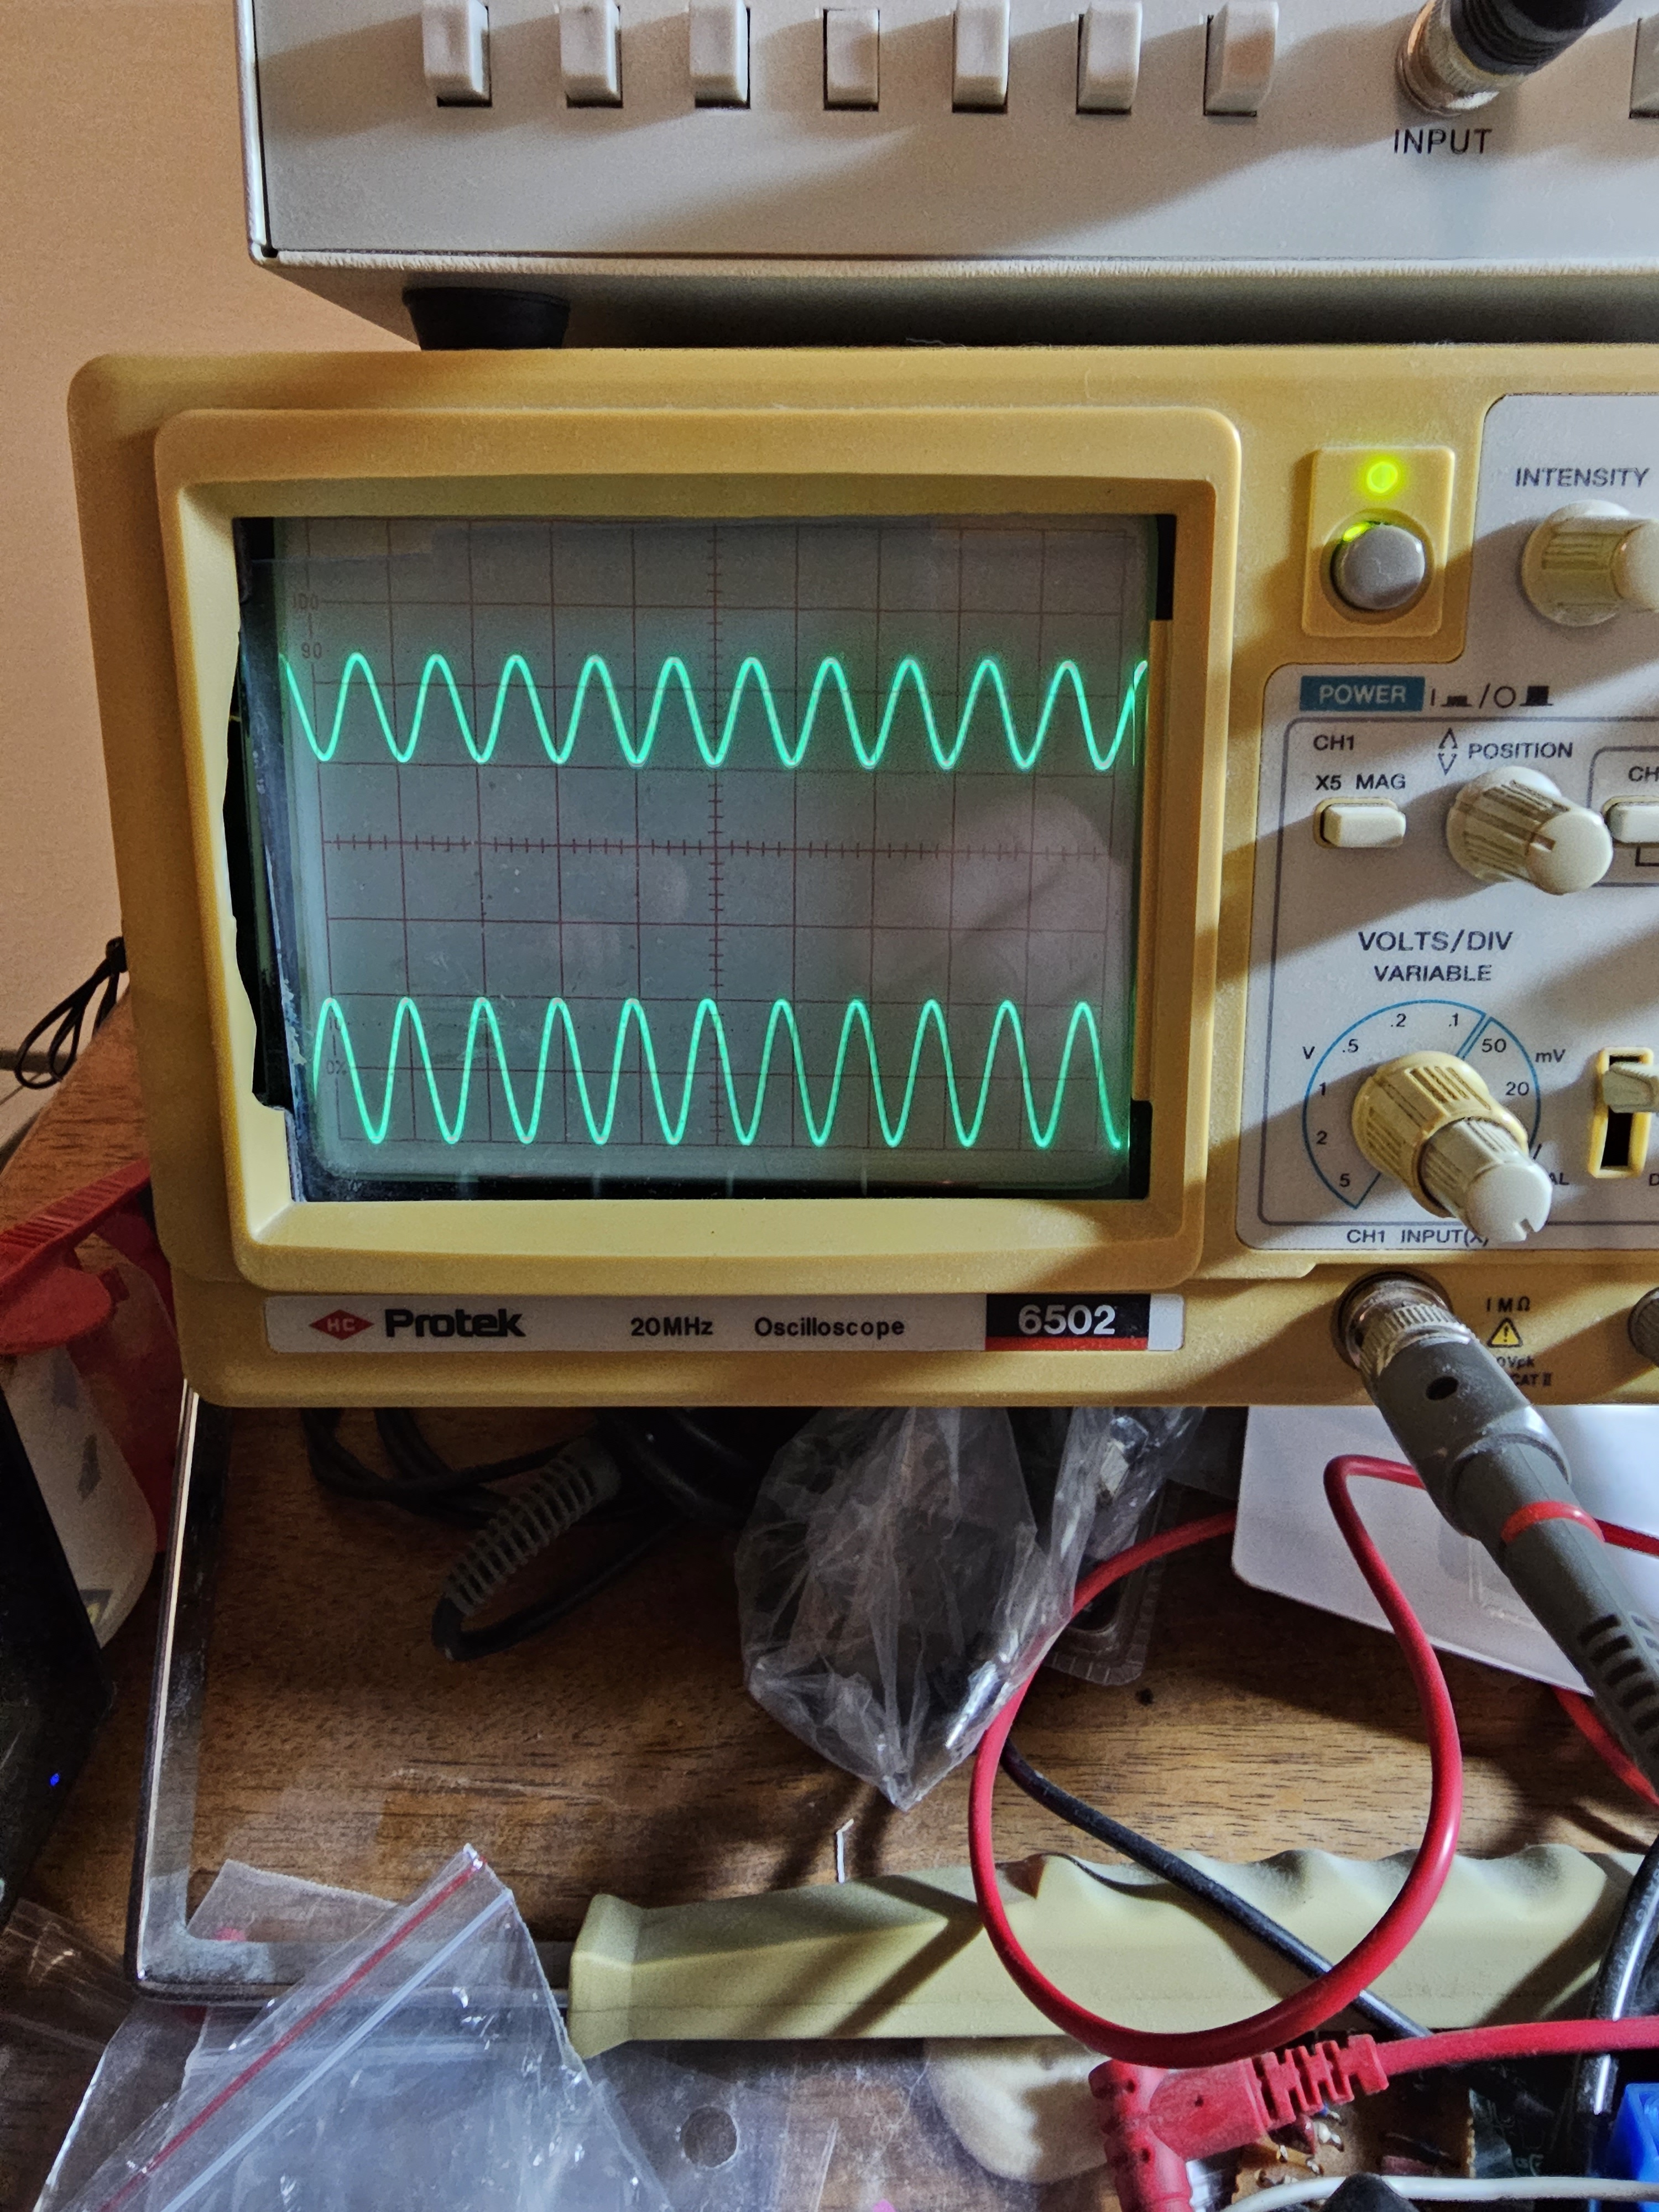
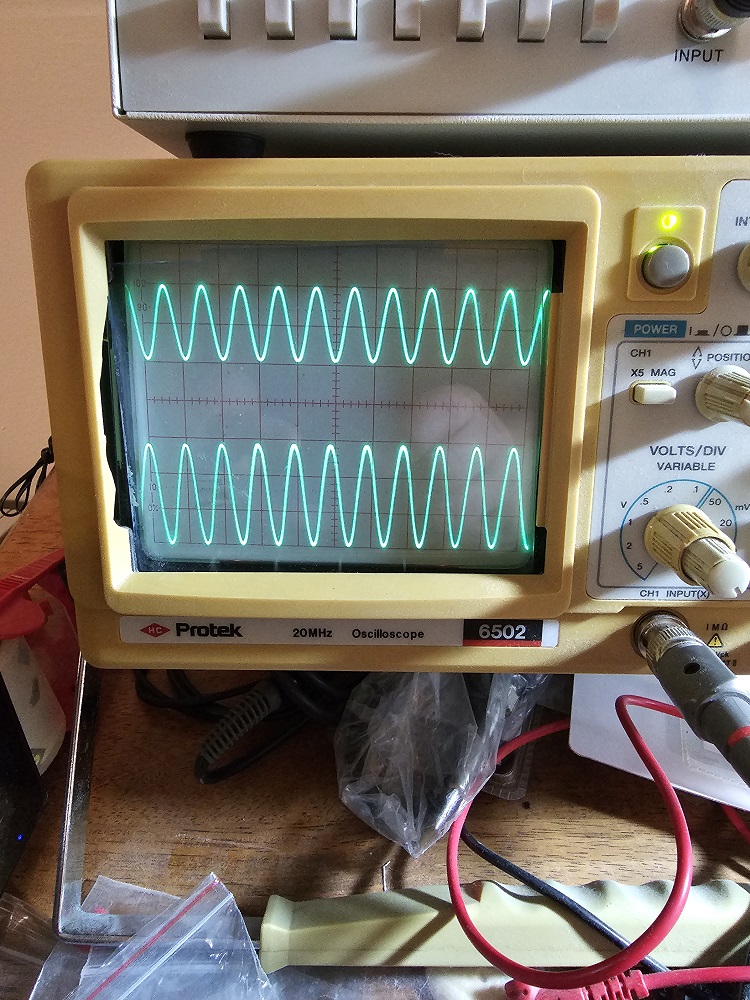
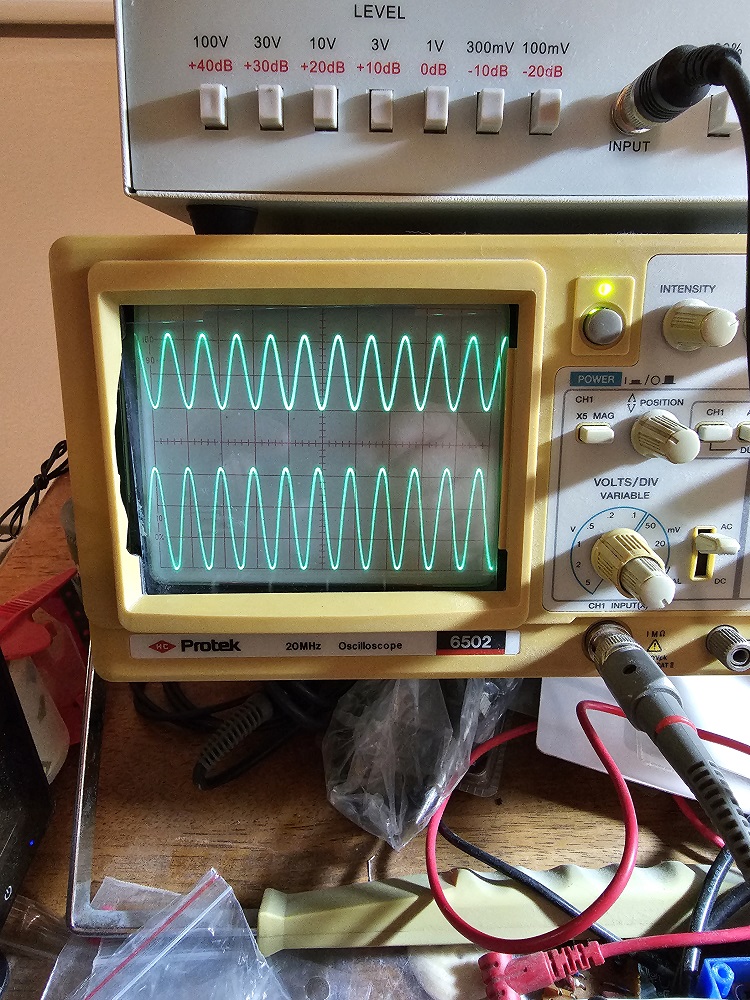
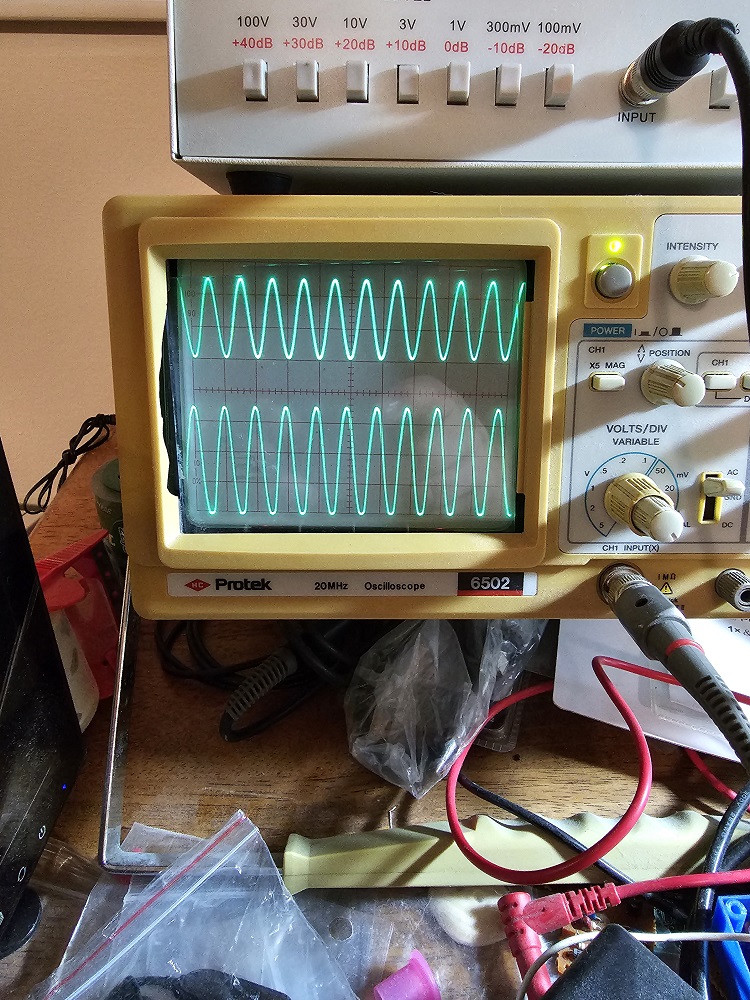
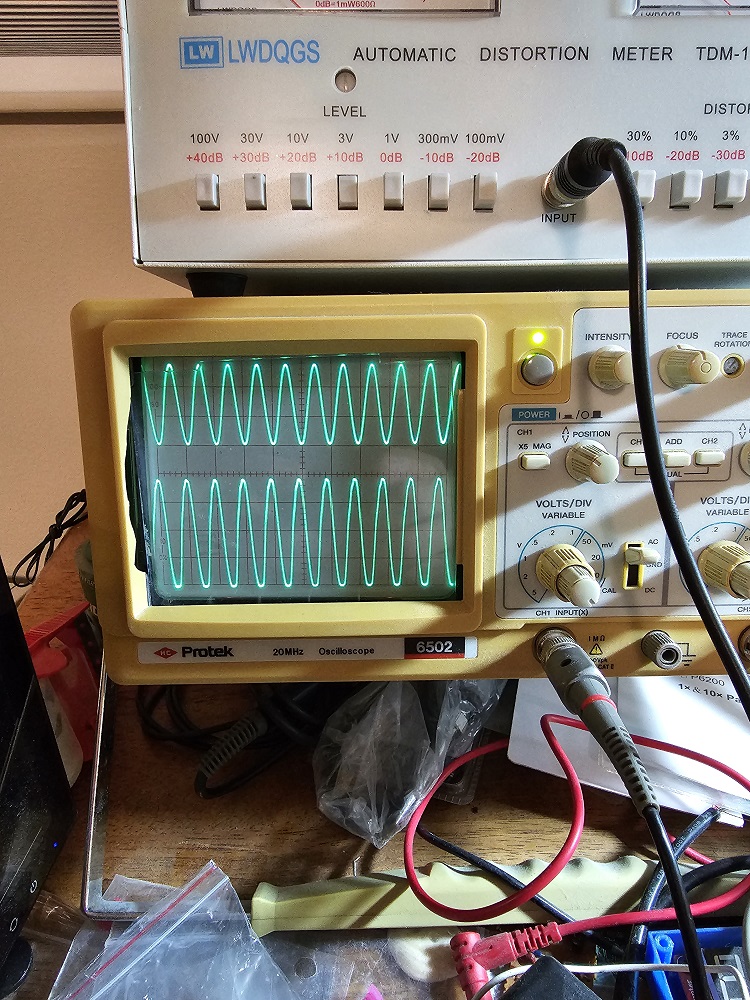
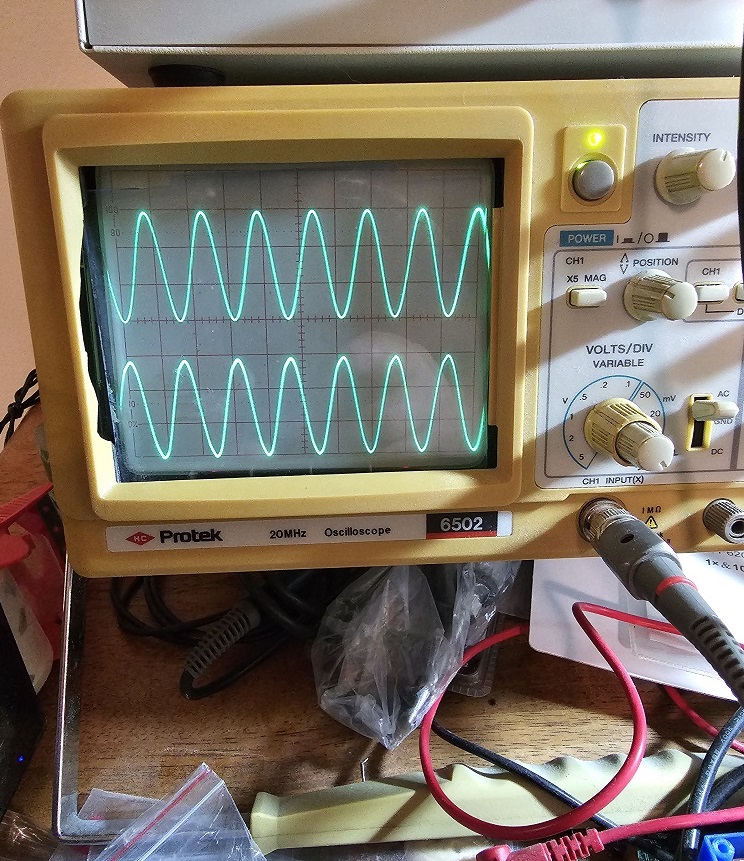
The right photo is the display of the oscilloscope where the top trace is what's
sampled at the 1200 pin 5 of the data port and the bottom trace is what's sampled
at the 9600 pin 4 of the data port. Both are AC coupled and set at 1V per division. The
top or bottom of the traces were lined up with a graticle so you can estimate what P-P
voltage the scope is reading.
Click on any image to make it bigger.
At 1 kHz deviation.
At 2 kHz deviation.
At 3 kHz deviation.
At 3.5 kHz deviation.
At 4 kHz deviation.
At 4.5 kHz deviation.
At 5 kHz deviation.

At 640 Hz deviation - where the P-P voltage matches on pin 4 and 5.
Video of a audio frequency sweep from 20Hz to 6kHz at 3kHz deviation with the top
trace being the output of pin 5 "1200" and the bottom trace being the output of pin 4
"9600". This shows what the effect of de-emphasis has as the frequency raises. The
absense of the signal at pin 5 in the beginiing is due to the CTCSS filtering appearing
at the 1200 output on frequencies below about 300 Hz these frequencies are intentionally
filtered. Matched audio output levels happens at 12-13 seconds where the audio
frequency sweeps through 640Hz.
Play the Video in MP4 format.
Play the Video in Windows format.
Email
Kevin Custer for additional support.
Product of Masters Communications, all rights reserved.
Specifications may change without notice.
Images are property of Kevin Custer - W3KKC
HTML March 28, 2023, W3KKC All Rights Reserved!